
SPY buy signal for NZ50 ETF Trade
After following markets for a few years, I’ve always wondered: Does the NZX just follow whatever happened overnight in the US market? and can you make money off it? To check I wrote a back-test in Python.
I used the following datasets: SPY (as the signal), FNZ.NZ (as the traded ETF), and the NZX50 index (for bench marking). The idea was simple: if SPY goes up, then buy the NZ ETF (FNZ.NZ) at NZ market open. These were the rules used to buy and sell:
If SPY’s return is greater than a set threshold, I buy (or continue holding) the NZ ETF at the market open.
If SPY’s return is below the threshold, I sell the NZ ETF at the open and move to cash.
The threshold was introduced to help reduce unnecessary trades. Since each trade includes a transaction cost, moving in and out of the market on tiny moves can eat into returns. By requiring SPY to be up by more than a small percentage, the strategy trades less frequently, ideally only when there’s a strong signal.
The test date ranged from 2010 to the present day. A transaction cost of 0.1% per trade was included to account for brokerage fees. I also imported the NZD/USD exchange rate so that all performance, including the SPY benchmark, could be compared in NZD on each date.
Did it beat the market? The answer, yes, but it comes with some caveats. If your goal was to maximize returns, you would have been better off just investing in SPY and holding it the entire time. But if you're looking for New Zealand exposure, this strategy could offer a smarter way to approach it than simply buying and holding the NZX50.
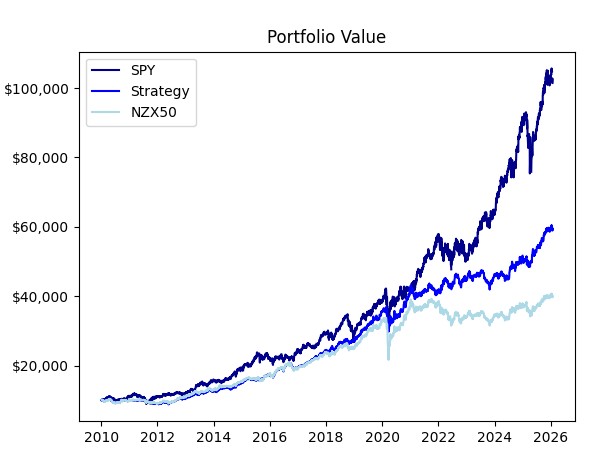
Here’s how a $10,000 investment from 2010 to today would have played out:
SPY final value = $90,067
Strategy = $52,921
NZX50 = $36,656
While the strategy did not outperform SPY, it did exceed the performance of the NZX50. But is this out performance statistically significant? To investigate this, we first summarize the average monthly returns:
SPY = 1.25%
Strategy = 0.94%
NZX50 = 0.75%
We test whether the strategy's mean return is statistically higher than the NZX50’s using a one-sided paired t-test. The hypotheses are:
H0 (Null Hypothesis): Strategy return <= NZX50 return.
HA (Alternative Hypothesis): Strategy return is > NZX50 return.
The t-test yields a p-value of 0.0267. Since this is below the 5% significance level, we reject the null hypothesis. At a 95% confidence level, the strategy’s average monthly return is statistically greater than that of the NZX50 index.
Portfolio and benchmark values over time.

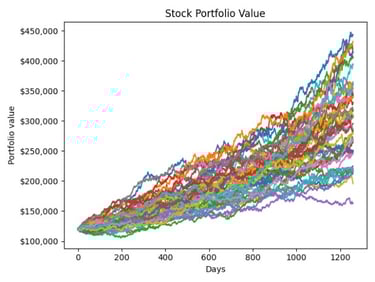
Simulated 50 paths in Python over a 5-year horizon for a diversified investment portfolio using historical returns and covariance data from Yahoo Finance. Applied Cholesky decomposition to incorporate inter-asset correlations between NZX50, S&P 500, and VT future returns. Estimated 95% Value at Risk (VaR) and Conditional VaR (CVaR) from the distribution of terminal portfolio values, visualizing downside risk through cumulative return paths.
95% Value at Risk (VaR) – Threshold of the 5% worst outcomes.
Final portfolio value: VaR = $94,025.86
Cumulative change from initial value: VaR = 1.01%
95% Conditional Value at Risk (VaR) – Average of the 5% worst outcomes.
Final portfolio value: CVaR = $70,862.46
Cumulative change from initial value: CVaR: -1.93%
Monte Carlo Simulation of Portfolio
Simulating the 50 paths of the portfolio.
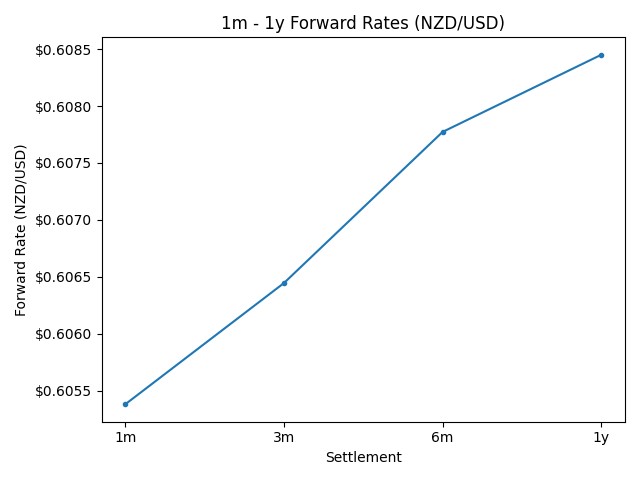
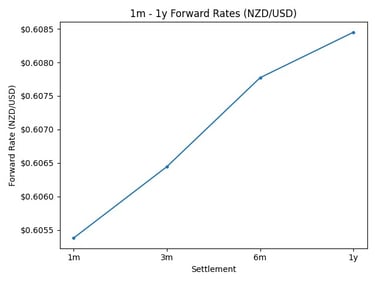
I explored the Interest Rate Parity (IRP) through a practical, automated example. Using Python, I collected interest rate data from FRED and RBNZ (B2) series, covering maturities of 1 month, 3 months, 6 months, and 1 year, alongside the current spot FX rate. I then applied IRP to calculate forward exchange rates based on the interest rate differential between New Zealand and the U.S.
Forward FX Using Interest Rate Parity
NZD/USD 1 month to 1 year forward rates using IRP.
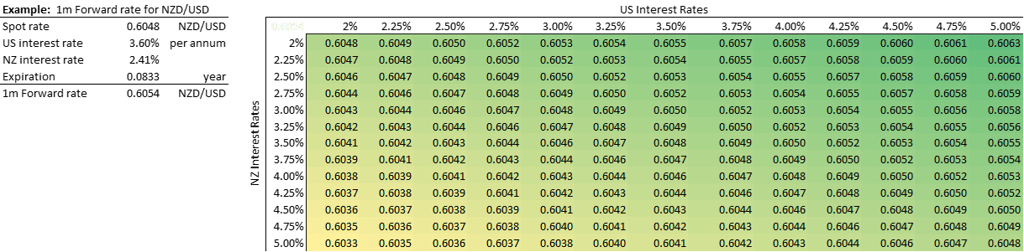
Impact of NZ and US Interest Rate Changes on the 1-Month NZD/USD Forward Rate.
For the 1 month forward rate, I performed a sensitivity analysis in Excel to show how it could change depending on movements in interest rates in both countries.
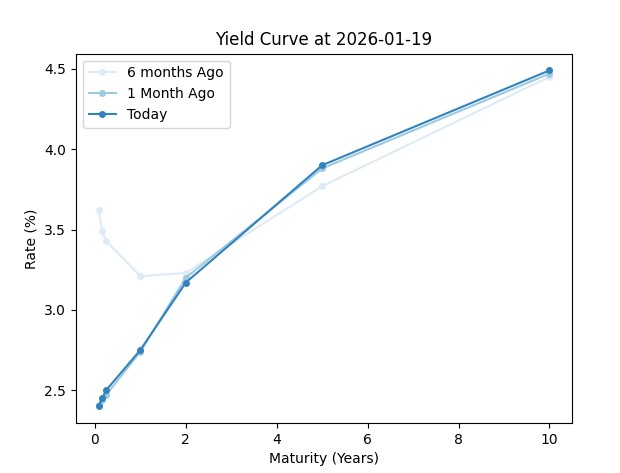

Python was used to automate the extraction and visualisation of RBNZ wholesale interest rate (B2) data, comparing the yield curve at the current date with one-month and six-month historical snapshots.
The yield curve plots yields for 30, 60, and 90 day bank bills, along with 1, 2, 5, and 10 year secondary-market government bonds.
RBNZ Yield Curve Monitor
NZ Yield Curve (RBNZ B2): Today, 1 month and 6 months ago.